We offer you all reporting formats: offline and online. And whatever format you choose, we want it to look handmade.
We want our research to make a difference to people and things. That is why we focus primarily on results reporting: We create reports and presentations that are visually compelling, have powerful argumentation and focus on the key findings.
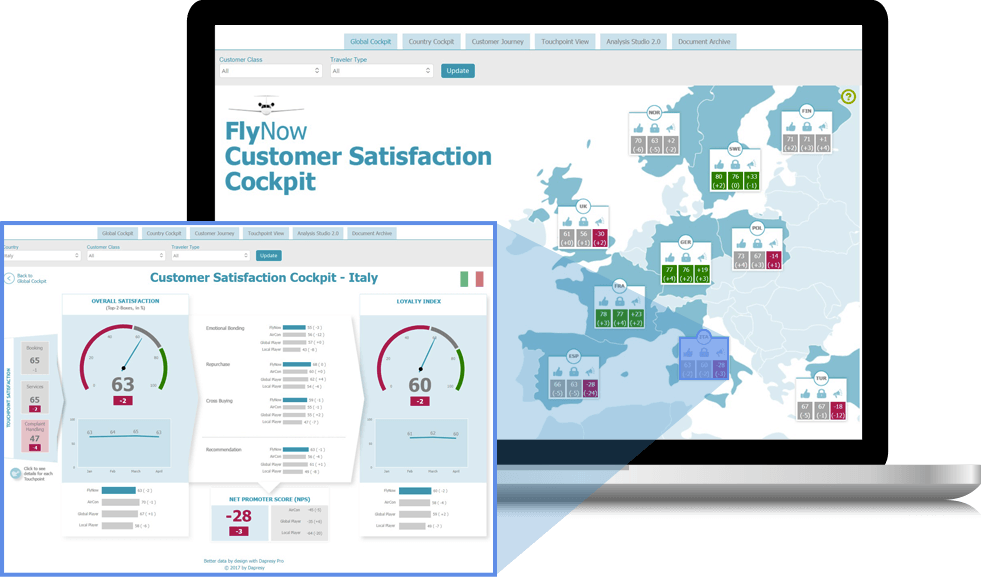
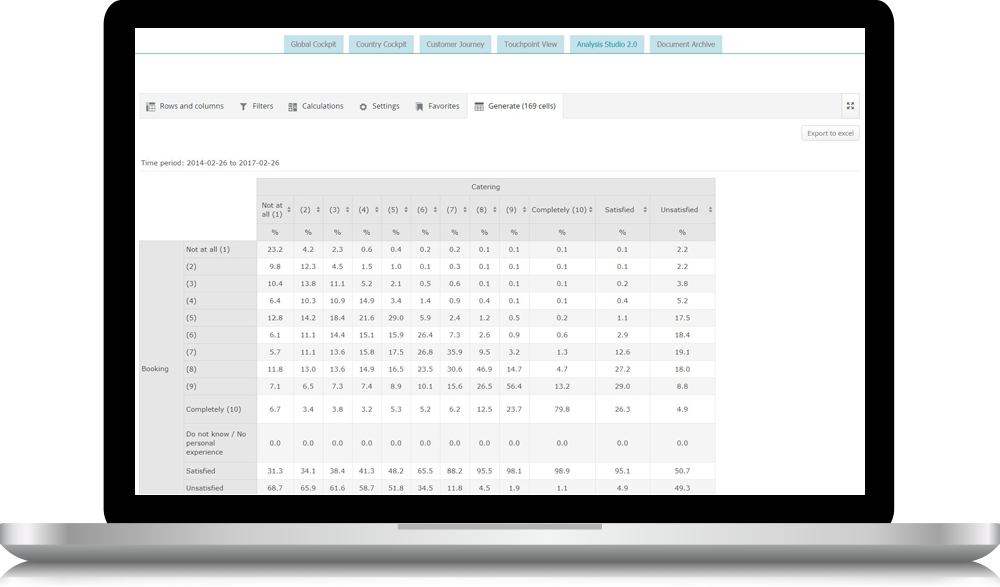
That applies to the manually created PowerPoint presentations just as much as to the automated reports we produce in large quantities for employee surveys and customer satisfaction studies. Or when we make our research results available online in dynamic web reports and dashboards.
The possibilities for presenting results are many and varied but our aim is always the same: Everything should look as if it has been handmade – carefully thought through and created with great attention to detail. And we do not accept technical restrictions. We believe everything is possible – even if it isn’t always easy to achieve the goal requested.